Categories
Analytics Google

This Is The Difference Between GA and GA4

Google Analytics has significantly evolved since its Universal Analytics (UA) version, leading to the development and launch of the newest iteration: Google Analytics 4 (GA4).

We’ll also share an example coaching & consulting funnel where conversion points must be added along the customer journey. These conversion steps can easily be added inside GA4.

But first… here is the simple summary of the key differences between these two versions (GA & GA4), along with their respective pros and cons.

Universal Analytics (UA)

Pros:

  1. Matured Features: UA has a long-established set of features that are well-understood and widely adopted by marketers worldwide.
  2. Advanced Segmentation: Users can create advanced segments to analyze specific data subsets.
  3. Integration with Google Products: Seamless integration with Google Ads.
  4. Goal Completions: Allows setting up goals to track specific user interactions.

Cons:

  1. Limited Data Connectivity: It operates on a session-based model, which can limit the ability to connect data across platforms.
  2. Inability to Track Across Devices: Struggles to provide a unified customer view across multiple devices.

Google Analytics 4 (GA4)

Pros:

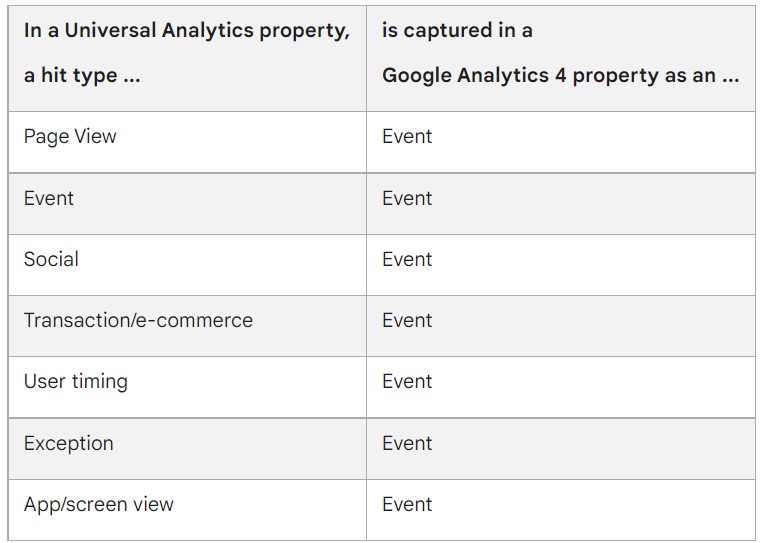
  1. Event-based Tracking: GA4 shifted to an event-based tracking system, allowing more flexible and comprehensive data collection.
  2. Cross-platform Tracking: GA4 excels in unifying user experiences across different platforms and devices, providing a complete customer journey.
  3. AI-Powered Insights: GA4 leverages AI to provide automatic insights, including data trends and anomalies.
  4. Improved Audience Building: GA4’s analysis hub allows more sophisticated audience building and better integration with Google Ads.

Cons:

  1. Learning Curve: As it’s a new platform, marketers may need to invest time in understanding and mastering GA4.
  2. Incompatibility: Some existing UA features, like custom dimensions and metrics, don’t translate directly to GA4. (But you can create and customize once you learn how to).
  3. Limited Historical Data: GA4 doesn’t import historical data from UA, making it challenging to compare current data with older data.

IMPORTANT: For now, Google is still supporting both versions, and you can run them side by side. But, as of July 2023, GA Universal is no more, and you must have migrated over to GA4.

ga_ga4-table-compare

HERE IS AN EXAMPLE OF A CONVERSION TRACKING APPROACH for consultants, experts and professional services.

You need a funnel and the ability to track and report on each step:

In a traditional consulting funnel, conversion tracking is pivotal to understand how well your marketing efforts are working and to optimize your funnel for maximum conversions.

The transition from lead to application and then to booking/appointment is a journey that needs to be carefully monitored and optimized.

In Google Analytics 4 (GA4), there are several critical points to track, but the top three are:

1. Lead Generation: This is the first conversion point in your funnel. It involves tracking whenever a potential client shows interest in your services by filling out a form, subscribing to your newsletter, downloading a free resource, etc.

In GA4, this can be tracked as a custom event, where the action of form submission or resource download triggers the event.

It provides valuable insight into how effective your initial call to action and lead magnets are.

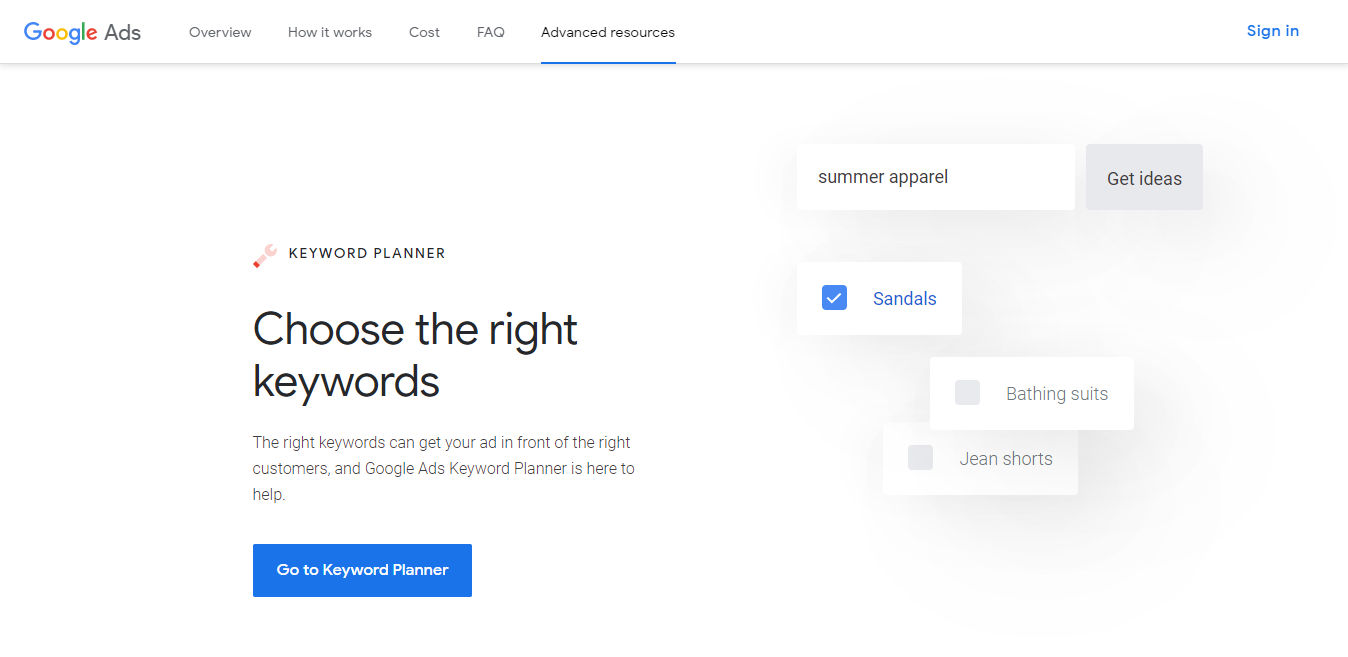
For any funnels that use Google ads (Search, YouTube), import these conversion points, track them, and feed data back to Google for your MQL’s and SQL’s.

2. Application Submission: The next crucial conversion point is when a lead submits an application or request for your consulting services.

The key here is to track not just the submission but also the quality of applications. Lead scoring is important for tracking, optimizing and preparing leads for the sales team.

In GA4, you can create a custom event for application submission and use event parameters to gather more information about the applicants, such as service they’re interested in, their industry, company size, and further qualification questions, etc.

3. Booking/Appointment Confirmation: This is the final conversion point where a lead can become a possible client by confirming a booking or appointment for the sales team (“the closers”).

You can track this in GA4 by setting up another custom event that triggers when a user completes the booking process.

This data helps you understand which marketing efforts are resulting in actual bookings and allows you to calculate your conversion rate from lead to client.

For each of these conversion points, you should also track the source or channel that the user came from (e.g., organic search, paid ad, social media, etc.)

This will provide valuable information about which channels are driving the most valuable conversions.

Remember, the goal is to use this data to optimize your funnel, improve your marketing ROI, and deliver a better user experience.

Regularly analyze your conversion data, look for trends and patterns, and make necessary adjustments to your strategy.

If you need help, reach out and connect with us here.

Categories
Adwords Analytics Facebook Ads Facebook advertising Wicked Reports

Mastering Google YouTube Ads and Omni-Channel Marketing – The Role of ROAS, Attribution, and MER

When managing your Google YouTube ads (and other popular ad platforms, like Meta Ads), understanding the balance between your spending and the return you’re getting is crucial. 

While the Return on Ad Spend (ROAS) is the most common formula used, the efficiency of your marketing as a whole can be better represented by another metric: the Marketing Efficiency Ratio (MER). 

Combined with sophisticated third-party attribution tools such as Wicked Reports, these calculations can offer you a clearer understanding of your ad campaigns’ true profitability.

Breaking Down ROAS and MER

ROAS is a simple equation that divides the revenue generated from an ad by the cost of that ad:

ROAS = (Revenue from Ad) / (Cost of Ad)

So, if you’ve spent $1000 on an ad and generated $5000, your ROAS is 5.

This means you’re earning $5 for every $1 you spend, suggesting a profitable ad campaign.

While ROAS is a valuable tool, it provides a narrow view of your marketing campaign’s performance.

This is where the Marketing Efficiency Ratio (MER) comes in. 

mer_vs_roasMER measures your total revenue in relation to your total marketing spend, giving you a broader understanding of your marketing efforts.

Calculating your MER can help optimize your budget allocation and improve your overall marketing strategy.

Implementing Attribution and Tracking Conversions

However, things can get complicated when you incorporate a multi-touch attribution model into your calculations. 

This model tracks and credits all marketing touchpoints that lead to a conversion, not just the final interaction. 

This is crucial in today’s omnichannel marketing world, where customers interact with your brand across multiple platforms before making a purchase.

SCENARIO: We often see complex patterns of user behavior. For example: A visitor watches your YouTube Ad (or parts of it). Later, they Google search your brand name and visit your website. In turn, they sign up for your email list. Finally, they purchase from one of your email sequences over time, a few weeks later, or even several months after the fact. If a subscription model, they are charged on future intervals and should be tracked.

Google partially solves this dilemma of tracking. Big G can implement attribution and track sales from offline conversions and over extended periods (30 days, standard):

  1. Google’s Attribution Models: Google Ads offers several attribution models such as last click, first click, linear, time decay, and data-driven. These can help you understand each touchpoint’s contribution to the conversion path.
  2. Google Analytics Multi-Channel Funnels: This tool helps visualize your customers’ conversion path, demonstrating how your marketing channels (organic, paid, social, email, etc.) collaborate to create conversions.
  3. Offline Conversion Tracking: This allows you to measure which ads lead to valuable offline actions, such as phone calls or in-store visits. You can import this data back into Google Ads to determine which campaigns drive the most profitable offline conversions.
  4. Customer Relationship Management (CRM) Software: By integrating your CRM with Google Ads, you can track long-term interactions and attribute conversions to the right marketing activities.
  5. Google’s Customer Match: This tool lets you use your online and offline data to reconnect with your customers across Google services.
  6. Google Analytics 4 Attribution: GA4 provides different attribution models. An attribution model can be a rule, a set of rules, or a data-driven algorithm that determines how credit for conversions is assigned to touchpoints on conversion paths.There are three types of attribution models available in GA4. Learn more about GA4 migration here.

Leverage Third-party Tools Like Wicked Reports

To bolster your understanding of your ad campaigns’ performance, tools like Wicked Reports can provide a deeper analysis of your data. 

Wicked Reports can reconcile your multi-touch attribution data with your long-term customer value data, offering a holistic view of your marketing performance. 

This can help you fine-tune your campaigns, aligning them with your customers’ behaviors and your business goals.

And, as an agency, we now have the proof of the entire “clicks-to-purchase journey” to show our clients and back it up with OrderIDs and customer names.

How Wicked Reports Differs From Google

Wicked Reports and Google Ads are both powerful tools that marketers can use to analyze and optimize their advertising campaigns. 

However, they approach attribution differently and offer distinct advantages. 

Here’s why you might find Wicked Reports to be more advantageous for tracking attribution:

  1. Long-term Attribution: Wicked Reports tracks customers over their entire lifetime, giving you insights into long-term ROI. Google Ads primarily focuses on a 30-day conversion window, which may not capture the full value of customer interactions over time.
  2. Cross-Platform Attribution: While Google Ads provides attribution information for ads within its ecosystem (Google Search, YouTube, etc.), Wicked Reports can track attribution across multiple platforms, including Facebook, Instagram, email campaigns, TikTok, Snapchat and more. This allows for a more comprehensive view of your marketing efforts.
  3. Sales-Based Attribution: Wicked Reports uses actual sales data (first party data) for attribution, giving you accurate ROI metrics. Google Ads often bases attribution on clicks or conversions, which doesn’t necessarily translate to actual revenue.
  4. Customer Journey Insight: Wicked Reports provides detailed information about the customer journey, showing how different touchpoints influence a customer’s decision to purchase. While Google Ads does offer some insights into the customer journey, it can be limited to interactions within the Google ecosystem.
  5. Cohort Analysis: Wicked Reports enables cohort analysis, allowing you to group customers based on their behaviors and evaluate the effectiveness of your campaigns over time. Google Ads doesn’t offer this level of analysis natively.
  6. Multi-touch Attribution: While Google Ads does offer several attribution models, Wicked Reports’ strength lies in its robust multi-touch attribution model that accurately assigns credit to each touchpoint in the customer’s journey, giving a more nuanced understanding of your marketing funnel.
  7. Funnel Vision Empowerment: This report provides a visual representation of the funnel and allows businesses to identify areas for improvement by tracking conversion rates at each stage. With the FunnelVision report, eCom brands can see which campaigns drive the most sales and adjust their marketing budgets accordingly. This allows them to allocate their resources effectively and optimize their campaigns to increase their ROI.

While Google Ads offers useful insights and tools for campaign optimization within the Google network, Wicked Reports provides a more holistic, revenue-focused, and cross-platform view of your marketing performance. 

It helps marketers understand how different marketing activities contribute to the bottom line over the lifetime of a customer, which can be crucial for strategic decision-making.

Summary

In conclusion, to ensure successful attribution: Maintain a consistent tracking strategy, regularly monitor and interpret your data, campaigns, and continuously optimize your marketing efforts based on your findings and actual data.

By understanding the customer journey, you can make more informed decisions on your marketing budget allocation for maximum impact. 

Combine the power of ROAS, MER, and third-party multi-touch marketing attribution software like Wicked Reports to amplify your YouTube, Google, Facebook, Tiktok, Pinterest, Snapchat, LinkedIn ad success.

Learn more here.

Categories
Analytics

6 Easy Steps to Migrate to Google Analytics 4

6 Easy Steps to Migrate to Google Analytics 4 (GA4) For Small Business

GA4-Migration-Checklist-Chaosmap

If you’re one of the 28.1 million businesses that use Google Universal Analytics tracking, you are probably fully aware that on the 1st of July 2023, this is being switched off.

Before this date, you’ll have to make the switch to Google Analytics 4 (GA4) or run the risk of not being able to track any data on your site.

Unfortunately, GA4 Setup isn’t as straightforward, and just clicking a button and hoping it’s done. And if you’re lacking any technical know-how, then you might be putting this task off. 

There’s no shortage of GA4 Starter guides out there, however, lots of them are filled with technical jargon that is impossible to get your head around. 

In this article, we give you easy-to-follow steps on the migration process to Google Analytics 4. Read on to find out how. 

Why Switch to GA4 Google Analytics Tracking?

You might be asking this question of why you have to switch. GA4 isn’t a redesign of the current Universal Analytics (UA). 

Think of it as a whole new product. Naturally, there are similarities between the two – however, there are several major differences, including the user and reporting interface as well as what data is collected and reported on. 

GA4 uses a significantly different data structure, data stream and ways to start collecting data.

Google Analytics 4 has everything built around users and a new event model, and not sessions. According to Google, this is the next generation analytics tool for data collection and presentment. It’s the new Google analytics, with enhanced measurement. Previous versions will be phased out, and the tool is a free version still.

Google Analytics 4 – GA4 Setup

ga4-setup-steps-google

We understand that the idea of setting up GA4 can seem daunting. Here’s our easy step-by-step guide on what to do.  

Back-Up Universal Analytics & Your Site

Before you start any technical type of work, it’s a good idea to back everything up before you begin. Run a backup on your entire website, and if you’re not sure how to – then ask your host or a developer to help. 

Read More: How can I export data from my Google Universal Analytics Property?

Before you make the switch to GA4, it’s worth backing up your analytics data. You can export this information manually to a range of supported formats, including Excel, CSV, and Google Sheets. 

Although your UA data will be around for a while, Google has said they are only keeping this for six months after the July 1st, 2023, switchover date. Your data won’t be around forever.

With UA, you can pull up to two months of data at a time as a CSV. Depending on how long you’ve used UA, this could take a while. It might be quicker to use the Google Analytics Spreadsheet Add-On

Step 1: Create Your GA4 Property

After backing up, you’re ready to start implementing GA4. The first step is to create your new GA4 property. 

ga4-property-setup-chaosmap

Your new GA4 properties won’t contain any historical data. It only starts tracking traffic data from the time you create it. The good thing is that you can switch between UA and GA4.

The earlier you create your GA4 account, the sooner you can start populating data in the GA4 dashboard.

Step 2: Add GA4 Tag to Your Site

Although you can do this manually, the easiest way to do this is by using Google Tag Manager

GA4 differs from UA. Universal Analytics only needed one tag type. GA4 needs two tags to track data. These are the Google Analytics Configuration Tag and the GA4 Event tags. 

Using the Google tag manager ensures both of these tags are assigned correctly. After you’ve added the tags, GA4 will start to gather data. It might take a day or so to see anything appear on the GA4 interface. 

Step 3: List Your Key Items

You’ll need to set up what you want to track on your new GA4 account. These are not pulled across from UA. In the first instance, the most common tracking items you’ll want to see are as follows;

  • Events
  • Goals (Conversions)
  • Content Groupings
  • Custom Dimensions/Metrics
  • Referral Exclusions
  • Product Link Connections
  • Audiences

There are differences in the wording between Universal Analytics and GA4.

Items that include hit types, such as views and sessions, have all been grouped under events. Also, conversions are now classified as goals. There are several other differences between the two analytics event tracking versions. 

It will probably take you some time to go through all the items you want to track. Each of these will need to be set up to ensure the correct date is being gathered. 

Step 4: Check Your Items Are Being Tracked

After you’ve been through each item in your new GA4 property, it’s time to double-check that everything is being tracked properly. 

Although they aren’t the same, you can toggle between UA and GA4 to see if the data is somewhat correlating. 

It will differ slightly; however, if there are major differences, this is a telltale sign that something isn’t set up properly. 

Step 5: Decide on a Date That GA4 Will Be Your Single Source of Data

While Google Analytics is in this transition stage, organizations are most likely drawing from the two different sets of data for reporting purposes. 

If you have a medium to large company, make sure that reports and data are all sourced from the same version of analytics.

By setting up GA4 early, you should have a solid backlog of data that you can draw on before UA gets switched off. 

One thing to be aware of is that you will get skewed results if you’re comparing UA data for one year and then GA4 data for the following year as they aren’t a like-for-like comparison.

Step 6: Archive Your UA Data

You made a backup of your current UA data. You may or may not want to switch this off instantly. Google had confirmed it’s keeping the historical UA data until January 1, 2024. After this date, it will be deleted. 

If you are running the two versions of analytics until UA gets switched off, be sure to make a backup before this date and archive it. 

Looking For More GA4 Starter Guides?

Hopefully, this step-by-step guide has told you everything you need to know; however, if you still have questions about GA4 Setup or need more explanation about Google Analytics 4, then we’re here to help. Google provides a Google Analytics 4 setup guide here.

FREE Download: GA4 Migration Guide – Simple Steps (PDF)

google-analytics4-starter-guides

And, at Chaosmap, we have on-hand experts ready to answer all your Google Analytics tracking questions. 

We’ll provide you with actionable solutions, direct you to GA4 starter guides and resources. And, if you’re still unsure, we can do the technical work for you. 

If you need to integrate and set up Google Ads, we do that as well. We provide detailed reports, have many reporting capabilities; ecommerce reports, cross device reporting, ROI reports, a migration checklist and we make sure everything is configured correctly. Make sure to start tracking with everything in the “plumbing” area working correctly, and that you have complete control going forward.

There is also a GA4 migration analytics starter page here.

Contact our professional team members today to find out how we can help.

Further GA4 Learning:

Categories
Analytics Campaigns Digital Advertising Analytics online marketing

How to Skyrocket Your Advertising Results With UTM Tracking

Do you have any idea what the largest source of traffic for your business might be? What about which social platform brings the most visitors to your site?

Having access to such data would be amazing! It allows you to maximize efficiency and focus on what’s already working best in your marketing.

So, what’s the secret to all that?

UTM tracking codes…

In today’s post, you’ll learn what UTM codes are, what makes them critical for your marketing success, and how you can create them on your own.

Let’s dive in.

What is UTM Tracking?

UTM tracking is a technique that uses snippets of codes to track website traffic and evaluate the effectiveness of digital marketing campaigns.

UTM codes are made of two parts — the URL parameter and the tracking variable, both of which come at the end of the URL.

UTM tracking codes

The URL parameter starts with “?utm_”, then one of the five parameters you want to track.

The tracking variable comes after the “=” sign and it could be anything depending on the parameter you’ve chosen. For example, if you’re tracking the source of your traffic, your tracking variable could be “Google”, “Twitter”, “Facebook”, etc.

Your final UTM code should look something like this:

https://www.yourwebsitecom/bestoffer/?utm_source=google

Note:

The UTM code in your URL won’t make any changes to your content. So, you can delete it at any time and still have your page working perfectly.

Why Is Tracking So Important For Marketing Success?

Traditional marketing relied heavily on non-targeted campaigns that spoke to no one in particular. Companies used to spend the majority of their budgets on prospects that had zero interest in those offers.

Without any feedback or data, they continued making the same marketing mistakes every time and lost millions of dollars in the process.

But with digital marketing, everything has changed…

Businesses today focus on smaller audiences with a much higher interest in their promoted offers. What allows them to do that is the wide variety of tools available when it comes to tracking, evaluation, and feedback implementation.

For example:

If you ever run an ad on Facebook, you’ll have some data available to you after the campaign. Based on that, you can identify what works and make better marketing decisions in the future. Which allows you to maximize sales while minimizing your ad spend.

Adding a simple tracking script on your ads in Facebook will help. In this advanced example, we’re using dynamic variables to track campaigns and more details from ads:

utm_source=facebook&utm_medium=ppc&utm_campaign={{campaign.name}}&utm_content={{ad.name}}&utm_term={{adset.name}}

That’s exactly why UTM tracking is vital for your online success…

How UTM Tracking Can Enhance Your Advertising

UTM tracking allows you to identify top-performing campaigns, pages, or content in your marketing.

Here are the five UTM tags you can use to create your UTM codes:

1- Traffic Source

This is used to track the source of your visits — such as social platforms, search engines, email campaigns, etc.

For example: utm_source=facebook

2- Medium

This parameter identifies the medium through which traffic is coming to your site, whether it’s social, email, paid ads, blogs, guest posts, etc.

For example: utm_source=email

3- Campaign

Are you preparing to announce a new partnership, feature, product, or promotion?

This is the best UTM tag to do that because it helps you specifically monitor campaigns instead of mediums or sources.

For example: utm_campaign=2021-summer-product-launch

4- Content

This parameter is used a lot in A/B testing to track URLs with multiple links pointing to them.

For instance, a landing page with many external links could have different variables for each button to help you identify which one is getting the most clicks.

For example: utm_content=cta-sidebar

5- Term

The term tag is especially important in paid search campaigns to monitor keywords and ad results.

For example: utm_term=best-seo-agency-us

How to Create UTM Codes For Better Tracking

You can write the UTM code yourself without the use of any tools. For example, if you want to track visitors coming to your page via Google, you can use the following code:

www.yourwebsite.com/blog-article/?utm_source=google

However…

We wouldn’t recommend this method for two reasons:

  • A simple typographical error can mess up your whole monitoring campaign
  • UTM codes are likely to get complicated when you’re tracking multiple parameters (in paid ads campaigns, for example)

The second method is a lot easier and guaranteed to be error-free. And it’s done using the Campaign URL Builder tool by Google.

Campaign URL Builder

Fill out the form with the required details for each input.

UTM Code Tracking URL

The tool will then generate a link that you can use anywhere online. (Note: In the example above, space is encoded to ‘%20’, since no spaces are allowed in URLs.)

Ready to Jumpstart Your Business With Digital Marketing?

Chaosmap is a leading digital agency helping businesses thrive through digital marketing, paid ads, and SEO.

Learn more about our digital marketing services and how we can help. Contact us today if you need anything, and we’ll be happy to discuss your project needs.

Categories
Adwords Analytics Budget Digital Advertising Analytics PPC

The Only 4 Metrics You Need For Profitable Advertising With Facebook & Google

Online marketing is a must for any business looking for serious growth today.

Your company can’t survive without advertising in a market where your competitors are spending multiple thousands of dollars on ads each month.

Yet…

Topping their advertising costs isn’t necessarily the smartest of solutions.

Your marketing can yield better results if you spend your budget where it serves you best. With that, you’ll make up for all your costs, attract better clients, and emerge profitable.

That’s why you must calibrate your marketing costs to ensure that your investments will succeed.

So that makes you wonder…

What metrics should I focus on to ensure profitable marketing?

1- Return On Ad Spend (ROAS)

ROAS is an essential metric that allows you to evaluate your ad spend and manage your budget more effectively.

It measures the expected returns for each dollar you spend on an ad. You’ll then be able to choose the best performing ads and spend more money on them.

You can easily calculate ROAS using the following formula:

ROAS=Revenue x Cost

For example:

If you spend $1000 and get $3000 in return, your ROAS is 3. The result means that — for each dollar you spend, you make three dollars back.

NOTE: When you are starting a brand new campaign (or existing), it’s necessary to also review your Average Order Value (AOV) and Cost Per Acquisition (CPA). Understanding these numbers will help track the “health” of your business and advertising overall. You’ll know that a CPA less than AOV is highly beneficial!

2- Return On Investement (ROI)

ROI is a financial metric used in many areas of business. It’s a ratio similar to ROAS, which also helps you assess your marketing campaigns’ success.

But…

Unlike ROAS, ROI deals with the overall costs of marketing and business. And it does that by looking at the net profit instead of revenue.

Here’s how to calculate the ROI for your campaigns:

ROI=Net Profit x Costs

For example:

A starter business has made $25000 in revenue in its’ first month. It spent $8000 on ads but also has additional financial costs of 18000$.

By running the calculations, we find:

(25000 – (8000+18000)) / (8000+18000) x 100 = -1000/26000 x 100 = -3.84%

The company has an ROI of -3.84, which means that it’s still losing money.

This is why you need both ROAS and ROI to better evaluate your success.

3- Customer Acquisition Cost (CAC)

CAC is the average cost a business pays to acquire a new customer. It’s a unique measure that can help you increase your profit margins significantly and dominate more markets.

Customer acquisition cost is calculated using the following formula:

CAC=(Marketing + Advertising expenses) / New Customers

For example:

A business spends $9000 (marketing expenses) each month to acquire new customers. That includes employer salaries, ad spend, paying for third-party tools, etc… The company acquired 150 new customers during that month.

In this case:

CAC = 9000 / 150 = $60

The business is spending $60 to acquire new customers, which can be either good or bad based on many factors.

But, the general rule of thumb is this:

A lower CAC allows more flexibility with your marketing budget as you can convert a lot more customers for lower prices.

4- Customer Lifetime Value (CLTV)

CLTV is a forecast of the total amount of money a customer will spend on your business. It tells you how valuable a client is throughout their whole relationship with your brand.

Calculating CLTV depends on your business plan and revenue model.

To calculate this measure, you must estimate the following :

  • Average sale value
  • Average number of transactions per customer
  • Average customer lifespan
  • Profit margins

Your formula should look something like this:

CLTV=average sale value X number of transactions X customer lifespan X profit margins

Calculating CLTV allows you to manage your ad campaigns more efficiently. You’ll have tangible numbers to compare to your customer acquisition costs.

You can then work on increasing CLTV and decrease CAC to boost profits and reduce costs.

Ready to Get Started With Paid Advertising?

Chaosmap has a dedicated team of digital marketing experts and professional advertisers at your service. We’ll help turn your company into a profitable business with paid advertising and PPC.

Take a quick look at our Pay Per Click services to learn more about our process. Contact us today to get a quote for your project.

Categories
Analytics Budget Campaigns Digital Marketing

6 Must-Have Tools For a Successful Google Ads Campaign

Any craft in this world requires tools to make the job easy.

And PPC is no different!

With the right set of tools, you can automate most of the process. You’ll find the best keywords, create ads quickly, research your competitors, and drive your costs down.

We’ve gathered five tools to help you gain competitive advantage and run successful Google Ads campaigns.

Let’s dive in.

1- Google Keyword Planner

Keyword research is all about identifying high-volume low-cost keywords for your campaigns.

But…

You can’t randomly add keywords to your campaign and cross your fingers it will work.

That’s a blind campaign.

Instead, you need a keyword research tool through in-depth research, and that’s where Google Keyword Planner comes into play.

Google Keyword Planner

Google Keyword Planner allows you to generate hundreds of relevant keywords for your campaigns — for free.

On top of that:

It will generate forecasts to help you gain valuable insights about how your keywords are likely to perform.

2- Ads Audit Report

This one is the fruit of our long years of hard work and experience in PPC marketing. And it’s an excellent tool for auditing Google Ads accounts quickly and easily.

Ads Audit Report works for advertisers of all sizes, from consultants to big agencies. It allows access to client accounts so you can review key data points and detect any new trends.

Ads Audit Report tool
Here are the most attractive features of our tool:

  • Trends over time identification (charts & numbers)
    • Clicks, impressions, spend, CTR, avg. CPC
  • Data breakdowns by ad platform
    • Spend, Impressions, Clicks, Conversions, CPA & avg. CPC
  • Top performing keywords analysis
    • Keyword cloud
    • Table breakdown (keyword, spend, impressions, clicks, conversions, CPA, CPC)
  • Top-performing ads inspection
    • Ad copy
    • Landing page
    • KPI’s
  • Period comparison reports with specific date ranges

Ads Audit Report dashboard

But here’s the impressive part:

While creating this tool, we made sure to incorporate our value-first philosophy into the process.

That’s why we developed distinct features to allow you to make recommendations for your clients on how they can improve.

You can efficiently identify wins and losses and focus on what’s working. And with that, you’ll help them see real changes in their business as early as possible.

Want to try Ads Audit Report for free today? Sign up for a free account and get up to 5 reports.

3- SEMrush

SEMrush is a campaign management software that helps advertisers boost their online visibility through advanced marketing analytics.

The platform is famous for its advanced SEO tools. Yet, it also has a powerful PPC side that can transform your results significantly.

SEMrush offers great competitor analysis options.

SEMrush PPC tool

You can use it to find out more about how your competitors run their ads. For instance, you’ll have the option to see their list of keywords and how they’re performing.

Another amazing feature is the Ad Builder, which allows you to use your competitors’ templates in your ads.

That’s a great option if you want to test different ads but you’re struggling to write a different ad copy for each one.

4- Adalysis

Adalysis is a PPC management software that helps you improve your ads through performance monitoring and testing.

Adalysis PPC management software

With this powerful tool:

You can oversee ad performance and be alerted whenever there’s an issue with your campaign.

You’ll also be able to run automatic A/B testing for thousands of ad groups to identify losing ads and remove them.

Another unique feature to help you gain great insight is Quality Score Analysis.

You’ll get access to a set of tools and algorithms to guide you towards boosting the quality score of different ads for all your campaigns.

5- Optmyzr

Optmyzr is another amazing PPC tool to help you optimize, monitor, and generate reports for your Google Ads campaigns.

There are lots of amazing features Optmyzr offers to its users.

Optmyzr ad management tool

Here are the ones we find most remarkable:

  • Identify low performing ads and pause them with a single click
  • Generate new keyword suggestions based on reports
  • Test different ad variants easily with tips on how to improve
  • Inspect and understand the changes happening in your various campaigns
  • Run audits to improve your overall campaigns after identifying the issues

Optmyzr is built for companies of all sizes. You can work on your own or add as many team members as you want – for no extra charge!

6- Shape.io

Shape.io is a budget management tool that grants you better control over your budgets with advanced tracking and optimization.

The software gives you access to many automated tools to help you save time and manage your ad spend wisely.

Shape.io budget management

For example:

You’ll avoid budget errors and minimize overspend in your PPC campaigns with integrated tools such as AutoPilot.

And:

With Budget Pacer and CruiseControl, you can adjust daily budgets automatically without having to pause your ads for too long.

Need Help Running Your Google Ads Campaign?

PPC is a great way to grow your business and reach more potential customers in no time.

But…

It takes long years of experience to be able to make all the right decisions and spend your budget wisely.

Need growing your business with paid advertising?

Check out our Pay Per Click services or contact us to get a quote for your project today.

Categories
Analytics

3 Keys To Optimizing Customer Performance Analytics

If you’re not leveraging customer analytics, you may be selling your business short.

In fact, companies that subscribe to the practice of collecting and leveraging customer analytics significantly outperform their competitors, according to McKinsey.

Moreover, firms that make extensive use of customer analytics are more than twice as likely as their competitors to generate above-average profit, sales and ROI — and they’re nearly three times as likely to generate superior revenue growth.

Achieving these types of results requires employing a smart customer analytics strategy.

In other words, merely having your IT department gather data without a solid strategy in place won’t automatically translate into financial improvements.

With that in mind, here are three keys to effectively leverage your customer analytics data for optimal business performance.

1. Draw Data from All Channels

In order to leverage customer analytics successfully, you need to base your analysis on a comprehensive view of data throughout your organization.

Sure, companies that work with data in silos may collect plenty of pertinent information, but they’re capturing just a snapshot of the buyers’ cycle, thereby only seeing a distorted view of their customers.

These days, customers expect the brands with which they do business to offer a comprehensive and efficient omni-channel experience.

In particular, implementing an omni-channel data-collection strategy should span all customer-facing departments of your company.

This includes marketing, sales and customer service.

Additionally, data collection should encompass all channels your customers use to interact with these departments.

For instance, your marketing data may include information collected from social media, mobile text messaging, email and other channels.

2. Integrate Your Analysis

Collecting data across all channels is only a preliminary step.

In order to put data to practical use, customer information assembled from various support channels should be collected into a central database for coordinated analysis.

This poses the challenge of how to synthesize data from multiple channels into a coherent whole. Ultimately, your company’s ability to integrate data effectively is heavily impacted by your software selection.

Software platforms that are designed to combine and analyze data from multiple sources greatly increase the efficiency of data integration.

For example, using an automation platform that tracks your online marketing practices across multiple channels makes it easier to obtain a holistic view of your various internet marketing campaigns, rather than having to log into each channel separately to perform an individual analysis.

Moreover, using a cloud-based call contact center allows you to pool your customer service data from all support channels, including chatbots, social media, mobile apps and interactive voice response.

3. Use KPIs and Benchmarks to Track Performance

In order to translate your data analysis into actionable outcomes, it’s vital to prioritize which key performance indicators to track and to set benchmarks that measure performance.

One of the most important KPIs to track is customer satisfaction scores.

In particular, soliciting feedback through post-sales surveys is one popular way to measure satisfaction.

Additionally, providing a means and encouraging your customers to interact with your brand on Facebook and Twitter is another cost-efficient way to gather data on satisfaction levels.

Other important customer-centric KPIs to track include customer lifetime value, customer acquisition costs, customer engagement and customer churn rates.

Additionally, it’s important to segment the performance of individual marketing channels and sales campaigns, allowing you to see how well your marketing and sales efforts are working.

However, you can improve the performance of your marketing and sales efforts by doing segmented tracking of the different customer demographics you serve so that you can see how well customers are responding to different promotions and offers.

You can then do split-testing for different demographic groups to adjust and improve your marketing and sales performance.

Smart use of customer analytics strategies can give your business a big boost.

Firstly, taking an omni-channel approach to data collection provides you with a complete picture of your customer interactions.

Then, through the use of integrated software tools, you’re able to better analyze your data and improve the ease and efficiency of your analysis.

Finally, employing KPIs and various other benchmarks enable you to translate your analytic-collecting efforts into practical, profitable results.

Understanding data is essential, and everything starts with a performance audit.

Categories
Analytics General

6 Essential Reasons To Use Google Tag Manager (Not Pure Google Analytics)

With Google Universal Analytics at long last out of beta, a lot of people are going to be transitioning from the old form of web analytics integration and overall script usage.

PROBLEM: Most sites and clients we come across still use the old Google Analytics code and use stacks of javascript from 3rd party vendors.

BEHOLD: There’s a new and better way to deal with page scripts for tracking and management.

There’s never been a better time to implement the new Google Tag Manager whilst transitioning through the upgrade.

The organization of scripts into one “container” (you simply place the new GTM code inside the <body> tag on your pages) is not only a great step forward, but it will aid in faster loading pages too. If your site is fast you know that your visitors will appreciate it.

The google tag manager model - the framework

The fact that you get centralized management, speed and agility is one thing.

Add to that the company governance and workflow (updates and deployments of sites from development, staging and production) with data accuracy and you have a winning formula.

The new way of using the GTM dashboard for containers, tags, triggers and variables management takes all the pain of script management to a very positive level for your business.

In truth, the improved automation, performance and reduced costs from something as “simple” as migrating from Google Analytics to Google Tag Manager should be obvious. If not, read this post:

Here are 6 Essential Reasons you won’t want to miss for you to transition and use the new Google Tag Manager.

#1 – Flexibility

Google Tag manager is ideal for flexibility. You’ll never have to involve a developer when you wish to tweak or modify a tag (scripts on your pages). This will save you time, money and a lot of headaches.

It allows you to focus on getting your web tracking working fast.

Easy to customize and even easier to achieve the tasks you want to complete. It’s never been easier or more convenient. With more flexibility you’ll find other tasks that you can do to make your site better than ever before.

#2 – Easy Upgrades

While the initial transition may be challenging or even seem daunting, once you’re done with all of the code swapping and maneuvering, you’re done.

It’s that simple.

Google has made it better than ever and they plan to continue improving upon the way they use tag manager and the interface. Meanwhile, you’re on the right path to improving your scripts management.

You can make your changes once and they will flow through to all of your pages. It’s that simple. Why would you want to have to do it more than once? Thanks to Google, you’ll never have to go through each and every individual page to make the changes that you need to have done.

Do it once … “set it and forget it”.

#3 – Acceleration

Since the new tag manager is quick, changes are done on an accelerated level. You won’t have to make a lot of changes to the code for your website. You’ll make your changes and be done with it, once and for all.

No need to revisit the site time and again to ensure that the changes have all gone through.

This will in turn speed up the launch time and ensure that your visitors won’t be wasting their time waiting for a page to load. In turn, this can keep your visitors coming back.

Visitors who find sites that load quickly and efficiently always appreciate it.

#4 – Debugging

Once you implement this, you’ll no longer have to worry about debugging scripts on your site.

Install the Google Tag Assistant as a complement to the debug process in Google Tag Manager.

This frees you up to apply your time to more important tasks such as adding in new and vital content.

Let’s face it, you have key things to do and you won’t need to stress over the website tracking. With debugging already built in, you’re sure to be up and running smoothly and effortlessly before you ever hit the publish button.

Automatic debugging is one of those vital components that helps you to remain on the cutting edge of technology. You’ll never be left to worry about those little glitches that your competitors stress over.

#5 – Versioning

It can be a pain each and every time you publish a new version of your website, or even migrating to another domain.

Google knows how much you need these vital elements so they have gone ahead and archived your former versions for you to refer to or re upload and utilize. If ever you need to “turn back time”, you’ll have it, right at your fingertips. With the click of a button you can simply go back and start over.

By utilizing this you can also organize your tags and keep track of them. This can also help you to find out if a certain tag isn’t doing what you need it to be doing and make the appropriate changes.

#6 – Pre-Built Tags

Thanks to built in tags, you can now select from a pre set list of tags that will help your tracking.

This one step can be vital to successful marketing. If you’ve never done coding before, you’re sure to appreciate the ease of this functionality. You can pick and choose, customize and set it all up simply by answering a few simple questions. If you are a developer, the marketing staff can update scripts directly, only with a quick email to let you know that a script has been applied.

Now — over to you.

It’s time to implement.

I assume you have a Google account already set up.

Just head over to tagmanager.google.com and get started.

As technology continues to move forward, more and more webmasters are making the move to Google Tag Manager. They’re updating their websites and are enjoying more visitors than ever before. It’s the perfect timing and you should make the move.

Now that you know the benefits, you’re sure to want to update your site.

NEED SOME HELP? Contact Us Here and schedule your time.


Watch the Google Tag Manager Video Fundamentals here:

Categories
Analytics

Big Data Analytics And Social Media – The Hype And The Promise

Big Data and What You Can Do With It

The amount of data in our world has been exploding. Eric Schmidt at Google has stated: “Every 2 Days We Create As Much Information As We Did Up To 2003“. (Techcrunch).

Imagine the scope! And, analyzing large data sets, called Big Data, is becoming a large basis of use for businesses and their competitors alike. “Data” is important to every aspect of business. However, data is especially powerful to those seeking to leverage search, social, mobile, local, video, marketing and emerging technologies to compete, provide actionable intelligence to executive teams, provide better customer experiences and earn more market share.

Big Data is a term often associated with Fortune 500 and 1000 companies because these enterprises often have greater resources to invest into the collection and analysis of data.  If you’re a social media “expert” and you don’t know the connection between Big Data and Social Media, then you should sit up and take notice.

Social Media by the Numbers – Twitter/Facebookbig-data-social-media-hadoop

The popularity of social networking has dramatically increased in recent years. Today, there are more than 1.11 billion Facebook users and 500 million Twitter accounts.  This growth has led to a rise in the amount of data created daily, with Facebook reporting 665 million active users each day. Moreover, with the increased interest in Big Data and the capabilities it provides, everyone is suddenly interested to discover exactly what it can do for their business.

With the growing prevalence of users to post an abundance of information about their everyday lives, it provides businesses an opportunity to monitor the data and identify patterns of behavior in individual users.  However, due to the vast amount of data produced by social networks on a daily basis, the analysis of this information cannot be performed with a mere software algorithm; rather it must be done using Big Data analytics.

What is Big Data?

Big Data is a collection of both structured and unstructured data sets that are so immense, ranging from a few dozen terabytes to several petabytes. The data is beyond the ability of regular software tools to capture, manage, and process it within a reasonable period of time.  Unstructured data, which constitutes around 90 percent of Big Data, is made up of emails, social media posts, tweets, videos, mobile phone calls, and website clicks. The Interwebs provides gargantuan user-generated content (UGC). Structured data makes up the remainder of Big Data and is information contained in databases.

Big Data Analytics is where businesses derive new meaning from new data sources. New, meaning that was never practical to discover before. This could be because of scale, data formats, the distribution of data in many locations, or the fact that no one thought of looking before – or how to make use of it in the first place. It is easily as much a new mindset as it is new technology.  Executives and technologists are continuing the discussion, but real world applications are now put to use. Tableau Software provides analytics in the cloud right now.

Who are the Largest Players in Big Data?

A science team at a leading edge technology firm that leverages massive Twitter historical data and many other social media datastreams – @datasift – analyzed the social interaction around big data in 2012. The result was shown in the big data social media infographic. The top five big data related tweets were Apache, 10gen, IBM, HP and Teradata. And, when it comes to big data services and infrastructures, don’t miss The Big Data 100.

Why Should Businesses Care? big-data-why-care

Businesses must care about Big Data so they can learn what to offer, to whom, when to offer something new, and what channels to use. It can also help them know if they can handle problems themselves or they need to get outside help, which competitor might be winning. Shareholders and upward moving company stock prices will reflect victories in this area. Big Data will be the one of the most important things for business since the Internet due to the business insights that it can provide.  However, a small mom-and-pop business may not use at this massive scale, but can get social media analytics and reports from tools like Hootsuite today.

Big Data and Social Analytics

Historically, data analytics software hasn’t had the capability to take a large data set and use it to compile a complete analysis for a query. Instead, it has relied on representative samplings or subsets of the information to render results. That approach is changing with the emergence of new Big Data analytics engines, such as the opensource Apache Hadoop.

Hadoop processes large caches of data by breaking them into smaller, more accessible batches and distributing them to multiple servers to analyze. Hadoop then processes queries and delivers the requested results in far quicker than old‐school analytics software—most often minutes instead of hours or days. Hadoop and other such systems provide complete looks at big data sets, instead of a team of analysts spending days or weeks preparing the parameters for data subsets and percent samplings.

Generate and Analyzebig-data-analyze-databases

So with this overload of data, you must understand how it can be analyzed. Keep in mind the difference between just “data” and the “right data” – data that drives actions. With social media, it can be confusing as to which data is “right,” but again, focus on data that drives actions – either a change in business processes or a change in behaviors. The key to fostering the growth of social media and Big Data is understanding how to make each work individually – one to generate the “right data,” and the other to process and analyze the data.

By using specific social media monitoring platforms such as Radian6 and Buddy Media, you are half way there and can take this data and use the specific results to drive campaigns. You can appeal to the masses by tracking trends, addressing consumer concerns through their feedback, and identifying key influencers who can become brand advocates. These are all excellent ways of using the power of big social media data analysis. Big data analytics platforms like Paraccel may be considered for larger enterprises.

Experience the Power of Data

If you’re actively working on any digital aspect of a brand without the benefit of data, you’re just wasting your time. In this digital age, it is essential to identify trends and opportunities. Now, more than ever, data will play a vital role in every aspect of business. Data always has been a goldmine for marketers (strategy, social, search, SEO, PPC, PR).

However, it’s safe to say that the anticipated growth of data and emerging use of unstructured data are game-changers. Working with Big Data and Social Media will only lead to greater success as technology continues to advance. Those who recognize and embrace the power of this mountain of data early on are most likely reap the most rewards.

You can learn more about digital analytics and big data from our analytics primer.