When managing your Google YouTube ads (and other popular ad platforms, like Meta Ads), understanding the balance between your spending and the return you’re getting is crucial.
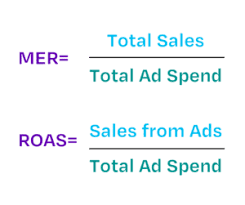
While the Return on Ad Spend (ROAS) is the most common formula used, the efficiency of your marketing as a whole can be better represented by another metric: the Marketing Efficiency Ratio (MER).
Combined with sophisticated third-party attribution tools such as Wicked Reports, these calculations can offer you a clearer understanding of your ad campaigns’ true profitability.
Breaking Down ROAS and MER
ROAS is a simple equation that divides the revenue generated from an ad by the cost of that ad:
ROAS = (Revenue from Ad) / (Cost of Ad)
So, if you’ve spent $1000 on an ad and generated $5000, your ROAS is 5.
This means you’re earning $5 for every $1 you spend, suggesting a profitable ad campaign.
While ROAS is a valuable tool, it provides a narrow view of your marketing campaign’s performance.
This is where the Marketing Efficiency Ratio (MER) comes in.
 MER measures your total revenue in relation to your total marketing spend, giving you a broader understanding of your marketing efforts.
Calculating your MER can help optimize your budget allocation and improve your overall marketing strategy.
Implementing Attribution and Tracking Conversions
However, things can get complicated when you incorporate a multi-touch attribution model into your calculations.
This model tracks and credits all marketing touchpoints that lead to a conversion, not just the final interaction.
This is crucial in today’s omnichannel marketing world, where customers interact with your brand across multiple platforms before making a purchase.
SCENARIO: We often see complex patterns of user behavior. For example: A visitor watches your YouTube Ad (or parts of it). Later, they Google search your brand name and visit your website. In turn, they sign up for your email list. Finally, they purchase from one of your email sequences over time, a few weeks later, or even several months after the fact. If a subscription model, they are charged on future intervals and should be tracked.
Google partially solves this dilemma of tracking. Big G can implement attribution and track sales from offline conversions and over extended periods (30 days, standard):
- Google’s Attribution Models: Google Ads offers several attribution models such as last click, first click, linear, time decay, and data-driven. These can help you understand each touchpoint’s contribution to the conversion path.
- Google Analytics Multi-Channel Funnels: This tool helps visualize your customers’ conversion path, demonstrating how your marketing channels (organic, paid, social, email, etc.) collaborate to create conversions.
- Offline Conversion Tracking: This allows you to measure which ads lead to valuable offline actions, such as phone calls or in-store visits. You can import this data back into Google Ads to determine which campaigns drive the most profitable offline conversions.
- Customer Relationship Management (CRM) Software: By integrating your CRM with Google Ads, you can track long-term interactions and attribute conversions to the right marketing activities.
- Google’s Customer Match: This tool lets you use your online and offline data to reconnect with your customers across Google services.
- Google Analytics 4 Attribution: GA4 provides different attribution models. An attribution model can be a rule, a set of rules, or a data-driven algorithm that determines how credit for conversions is assigned to touchpoints on conversion paths.There are three types of attribution models available in GA4. Learn more about GA4 migration here.
Leverage Third-party Tools Like Wicked Reports
To bolster your understanding of your ad campaigns’ performance, tools like Wicked Reports can provide a deeper analysis of your data.
Wicked Reports can reconcile your multi-touch attribution data with your long-term customer value data, offering a holistic view of your marketing performance.
This can help you fine-tune your campaigns, aligning them with your customers’ behaviors and your business goals.
And, as an agency, we now have the proof of the entire “clicks-to-purchase journey” to show our clients and back it up with OrderIDs and customer names.
How Wicked Reports Differs From Google
Wicked Reports and Google Ads are both powerful tools that marketers can use to analyze and optimize their advertising campaigns.
However, they approach attribution differently and offer distinct advantages.
Here’s why you might find Wicked Reports to be more advantageous for tracking attribution:
- Long-term Attribution: Wicked Reports tracks customers over their entire lifetime, giving you insights into long-term ROI. Google Ads primarily focuses on a 30-day conversion window, which may not capture the full value of customer interactions over time.
- Cross-Platform Attribution: While Google Ads provides attribution information for ads within its ecosystem (Google Search, YouTube, etc.), Wicked Reports can track attribution across multiple platforms, including Facebook, Instagram, email campaigns, TikTok, Snapchat and more. This allows for a more comprehensive view of your marketing efforts.
- Sales-Based Attribution: Wicked Reports uses actual sales data (first party data) for attribution, giving you accurate ROI metrics. Google Ads often bases attribution on clicks or conversions, which doesn’t necessarily translate to actual revenue.
- Customer Journey Insight: Wicked Reports provides detailed information about the customer journey, showing how different touchpoints influence a customer’s decision to purchase. While Google Ads does offer some insights into the customer journey, it can be limited to interactions within the Google ecosystem.
- Cohort Analysis: Wicked Reports enables cohort analysis, allowing you to group customers based on their behaviors and evaluate the effectiveness of your campaigns over time. Google Ads doesn’t offer this level of analysis natively.
- Multi-touch Attribution: While Google Ads does offer several attribution models, Wicked Reports’ strength lies in its robust multi-touch attribution model that accurately assigns credit to each touchpoint in the customer’s journey, giving a more nuanced understanding of your marketing funnel.
- Funnel Vision Empowerment: This report provides a visual representation of the funnel and allows businesses to identify areas for improvement by tracking conversion rates at each stage. With the FunnelVision report, eCom brands can see which campaigns drive the most sales and adjust their marketing budgets accordingly. This allows them to allocate their resources effectively and optimize their campaigns to increase their ROI.
While Google Ads offers useful insights and tools for campaign optimization within the Google network, Wicked Reports provides a more holistic, revenue-focused, and cross-platform view of your marketing performance.
It helps marketers understand how different marketing activities contribute to the bottom line over the lifetime of a customer, which can be crucial for strategic decision-making.
Summary
In conclusion, to ensure successful attribution: Maintain a consistent tracking strategy, regularly monitor and interpret your data, campaigns, and continuously optimize your marketing efforts based on your findings and actual data.
By understanding the customer journey, you can make more informed decisions on your marketing budget allocation for maximum impact.
Combine the power of ROAS, MER, and third-party multi-touch marketing attribution software like Wicked Reports to amplify your YouTube, Google, Facebook, Tiktok, Pinterest, Snapchat, LinkedIn ad success.
Jon Rognerud and Chaosmap work with Fortune 500 companies, associations and entrepreneurs to create digital traffic strategies that scale up members, customers, leads and sales with profitable returns. Mr. Rognerud wrote a best-selling book (Buy On Amazon), “The Ultimate Guide To Optimizing Your Website” (Entrepreneur). Connect directly here.


